2015-02-01
2015-01-29
Performance Bugs: How to find? How to report?
In this article we are going to know how to find bugs related to performance as well as how to report them. This is very basic checklist which will differ based on your project. I will try to give example with asp.net web application.
To know about basic bug and reporting , you can see one my previous posts which tells us all about a bug report.
Performance Bugs :
This is kind of admiring that Performance bugs are hard to find. Very difficult to get the evidence. So, if you are finding bugs, you have to be preferred with full performance goal and requirements.
And, you have to monitor your application as well as resources(CPU/Memory/Disk/IO etc).
While monitoring resources, you have to see the pattern of resource uses and application behavior.
You need to make heuristics analysis either with pen and paper or inside monitor tool to observe the change behaviors.
This way you can get the scenario or scope of area for possible bug. It's more like investigation and waiting for possible incident(like Sharlok Homes).
Before doing that, you must know the Architecture of your
->Application (Development and Deployment model, framework used, platform architecture, security modules etc)
->Infrastructure(How deployed, environment, which code/modules executes where & how)
And you also should know, why you are testing in every aspect (Goals and Requirement)
Example : I consider following for an individual request to find bug for my last project(web)
1. What is the size of the request?
2. How much time it needs for going to server and coming back with http 200 messages(server get the request) and with responses.
3. What are parameters we are sending as request in Http body, URL and Headers?
4. Why we are sending which parameters?
a. Categorizing those parameters,
i. Which parameters are based on client behavior/step
ii. Which parameters are based on client data?
iii. Which are based on environment
iv.Which are based on our application implementation
b. Finding unnecessary parameters which browser send from client and how can we eliminate them.(optimization)
i. Eliminating unnecessary parameters(based on business logic)
ii. Optimize necessary parameters(like view state, call backs)
c. How can we make those requests more precise and optimize for communication.
d. Organizing resources(JS/AJAX/Image/CSS/JQuery)
e. Compress the requests and responses
f. Using long time cookie for static resources with expire ending.
5. Why we are sending request in this manner? can we send in any other way to keep the application faster?(like replacing post back calls with Ajax)
How to get the Evidence?
Difficult bugs comes with much harder traceability...:)
So, as it is hard to find, you have prepare for evidence. Usually, performance bug evidence can be found in these aspects.
a. While debugging application from client and server for defined test steps. This should be done with tools as well as manually. (before performance test script generation in tool)
b. Monitoring resources and application while performance testing(like : IIS/apache, hosted PC, Application , DB for a web application)
c. Analyzing Reports generated by performance tools after test execution
d. Client side single user execution during high /peak load test is going on. You have to have debug tools enabled along with browser monitoring tools(web product)/proxy based tools.
So, to get evidence,
->I suggest to be prepared for Screenshots/Video recording for analysis later on.
->Make some Log analysis scripts or parsers to have quick log analysis.
->Be prepare with Pen & Paper to make quick notes.
->Make you mind for observing interesting important items which you see and related to goal
->Try not to interrupt test execution, better to let it finish
->Try long term test execution , when you need to test capacity of your application . I prefer 12/24 hour run over weekends.
->Try mixing up load scenario for different execution, More user, less time, more user long time, constant user increment, user high-low combination(like spike) , combining high load and security scanning etc
This is fully depend on application that you are working with. It may not be based on my experiences. Try to get more load scenarios involving with your application architecture & performance goals.
How to write a performance bug report? :
This is interesting, usually bugs are very specific to UI or user interactions. But, as performance testing is more related to application architecture testing. So, performance bugs should also have reference with application execution as well as how it happened from architectural prospective. That means, this standard procedure of bug reporting and + Something. And This "something" part should be developer friendly as well as full detail with references(as developers will read and get find what you are trying to explain). Let's see more detail on the "Something" with example.
Example , for a web application with http protocol, when you click a button, a function bug will refer to only the use case, but a performance bug should also refer to what request we send to server & received from server in details.
You should add reference on the requested URL, header details, body details. It should have detail explanation on those areas.
For this example, let say a http request Body has 25 parameters & 21 of them with values. So,
- What are those parameters,
- What are the reference of the parameters,
- Why those values are there.
Same justification for request header also. Up to this, it is only description.
So, what will be inside evidence? It should reflect your requirements. Let's say you need to know size, time and capacity for this request and you get the bug. So, in bug report you should provide
a. The total size of the request send to server
b. Time taken for server processing(http 200 response) for this requests
c. How the time varies in case of different load scenario
d. How many responses are received for this request.
e. Individual and total size of all of those responses.
f. Individual and total time of all of those responses for different load scenarios
g.What is the rendering time for those request(Time from individual single user perform the same task in browser – server response time calculated from server)
h. For Rendering, which response takes how much time in browser(from browser tool, or fiddler or proxy)
And, From individual request, you need to break down each parameter detail and possible cause for taking the amount of time that the request is taking.
For advance QAs : (Root Cause Analysis & Suggestions) :
You can go more further, for that you might need to have access of the code. You have to include profiler and should see what cause taking more time for that single request processing.
For web application, use profiler in IIS as well as in code base to pinpoint each request impact. Like, we are doing in our project , tracing from IIS, prove with profiler in IIS, tracing respective event inside code with code analysis tools and provide evidence on what cause the extra time.
Some, senior QAs can go more further. They can provide possible solution to overcome situation.
Example : In our project, we have found , we are not using viewstate(asp.net) properly that cases a huge time. So, we are in need for optimizing view state. But, there are several ways to do. So, we are suggesting different ways as well as impact of the ways for solving. This involve retesting ,that verifies the bug . This part should consider business requirements as well as security requirements.
So , summary, a bug should contains steps to reproduce and standard items mandatory for a function bug , as well as Screenshots, Logs, Charts, test results, Analysis reports, Code snipped, Demo projects, tool references etc.
Thanks...:)
2015-01-15
Performance Testing in a Nutshell
In this article we are going to see Performance testing activities at a glance. The basics of performance testing.
The goal of this post is to have basic idea on how they start and follow-up.
The goal of this post is to have basic idea on how they start and follow-up.
So, here is a small flow chart type(not strictly following flow chart rules) description to illustrate what are the basic steps for a performance testing from my project experience.
Viewers can add their comments and their experiences too.

Test closure activity is fully based on which methodology you are using in development. I have added small agile practice that I have worked on.
Google Drive Share for this UML..
Thanks…:)
2015-01-06
Jmeter webdriver sampler code style: Jmeter Client Side Performance Testing
In this article we are going to see the Jmeter Webdriver sampler code style. Code style refers, how it is constructed, how it is run, how we can apply different ways to resolve issues.
Jmeter supports a verity of scripting language to run on it. Webdriver sampler simply use Java Script execution. That means, it follows
This specifications to Run code on running JVM.
This specifications to Run code on running JVM.
From my previous post, you might have idea on how the script was construct. Let me explain details.
Rule 1 : no need semicolon(;) ending
Rule 2 : We can use any run time Java library by Java Importer. Like here we are importing Selenium and Time
var selenium = JavaImporter(org.openqa.selenium)
var time = JavaImporter(java.util.concurrent.TimeUnit)
var time = JavaImporter(java.util.concurrent.TimeUnit)
So, We can get all Java framework classes as well as any other added jars classes by this way.
Rule 3 : How to parameterize? Its simple, like as Jmeter variable call ${variable name}
Rule 4 : WDS functions , Just go this link and you will get the details. Let me describe them in overview on how to use them WDS.name, WDS.parameters,WDS.args
WDS.log – Write anything in Jmeter Logs. It helps for debugging.
WDS.browser – This is the Driver Object which represents the Browser. .
WDS.sampleResult – This have all methods applied on results. Like , measuring time, sub sampling, failure state capture. This actually extended functionality of HTTPSampleResults. We can see, we can apply
WDS.browser – This is the Driver Object which represents the Browser. .
WDS.sampleResult – This have all methods applied on results. Like , measuring time, sub sampling, failure state capture. This actually extended functionality of HTTPSampleResults. We can see, we can apply
->Assertion over results
->Sub sampling (breaking big test case in small results)
->Measure time and size for any step
->Get Meta data information of page(like encoding, data types, thread, header, label information like this)
For detail, the API link should be useful. . So, basically, we have to work with WDS.browser which is same as driver object (firefoxdriver) from selenium webdriver.
We need to careful when we are relating selenium code style in webdriver sampler..
1. This is single file code structure, so avoid page object pattern and other utilities . You may use simple screenshots within single script.
var screenshot = WDS.browser.getScreenshotAs(selenium.OutputType.FILE)
screenshot.renameTo(java.io.File('screen.png'))
2. Don’t forget to add wait time which we do when initialize driver class in selenium
WDS.browser.manage().timeouts().pageLoadTimeout(10, timeunit.SECONDS);
It will need associate two package, add them also.
3. Try to use screenshot to debug, spatially Complex UI items. Keep this same important as selenium regression tests.
It is an incremental post, I will update those point step by steps.
Thanks…:)
How to debug steps in Jmeter Webdriver sampler?Jmeter Client side performance testing
In this article we are going to see how we can debug steps written in webdriver sampler.
This will help us finding specific step time as well as fail conditions. That means, if you are making script for long term project, it is must.
To make a good debug-able client side script, we can organize code in two ways.
Step 1 : Add WDS.sampleResult.subSampleStart(‘label of the step’) , this will create sub sample with the label you specified.
Step 2: Write your step to be performed in the browser.
Step 3 : Add WDS.sampleResult.subSampleEnd(true) to close this subsample.
Let see view result tree :
This will help us finding specific step time as well as fail conditions. That means, if you are making script for long term project, it is must.
To make a good debug-able client side script, we can organize code in two ways.
1. Sub sampling the steps:
In my previous post you know how to active this. (by adding webdriver.sampleresult_class=true in user.properties). This is not needed for latest edition (plug in version 1.1.3)
So we will see how to divide them in sub samples.
Update : in current jmeter 5.3, the property will be
webdriver.sampleresult_class=com.googlecode.jmeter.plugins.webdriver.sampler.SampleResultWithSubs
Step 1 : Add WDS.sampleResult.subSampleStart(‘label of the step’) , this will create sub sample with the label you specified.
Step 2: Write your step to be performed in the browser.
Step 3 : Add WDS.sampleResult.subSampleEnd(true) to close this subsample.
Its very simple. Lets apply to the scripts described in previous post. I will every process separate, like this
1: var selenium = JavaImporter(org.openqa.selenium)
2: var time = JavaImporter(java.util.concurrent.TimeUnit)
3: WDS.browser.manage().timeouts().implicitlyWait(30, time.TimeUnit.SECONDS)
4: WDS.sampleResult.sampleStart()
5: WDS.sampleResult.subSampleStart('Goto Home Page')
6: WDS.browser.get('https://www.sumazi.com/')
7: WDS.sampleResult.subSampleEnd(true)
8: WDS.sampleResult.subSampleStart('Click About')
9: WDS.browser.findElement(selenium.By.linkText("About")).click()
10: WDS.sampleResult.subSampleEnd(true)
11: WDS.sampleResult.subSampleStart('Click Uses')
12: WDS.browser.findElement(selenium.By.linkText("Uses")).click()
13: WDS.sampleResult.subSampleEnd(true)
14: WDS.sampleResult.subSampleStart('Click Team')
15: WDS.browser.findElement(selenium.By.linkText("Team")).click()
16: WDS.sampleResult.subSampleEnd(true)
17: WDS.sampleResult.subSampleStart('Log In request')
18: WDS.browser.findElement(selenium.By.linkText("Login")).click()
19: WDS.browser.findElement(selenium.By.name("username")).clear()
20: WDS.browser.findElement(selenium.By.name("username")).sendKeys("shantonu_oxford@yahoo.com")
21: WDS.browser.findElement(selenium.By.name("password")).clear()
22: WDS.browser.findElement(selenium.By.name("password")).sendKeys("1234567890")
23: WDS.browser.findElement(selenium.By.linkText("Submit")).click()
24: WDS.sampleResult.subSampleEnd(true)
25: WDS.browser.navigate().back()
26: WDS.sampleResult.subSampleStart('Click Blog')
27: WDS.browser.findElement(selenium.By.linkText("Blog")).click()
28: WDS.sampleResult.subSampleEnd(true)
29: WDS.sampleResult.sampleEnd()
And if we run, we can see like this from view result tree.
This is because of this parts in the code
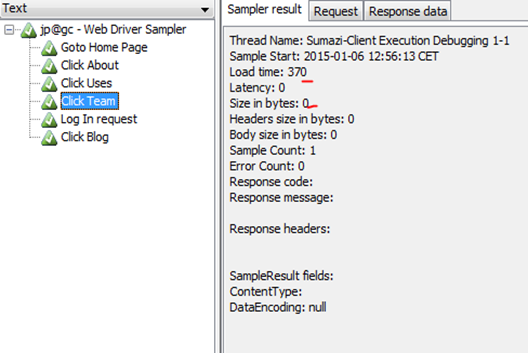
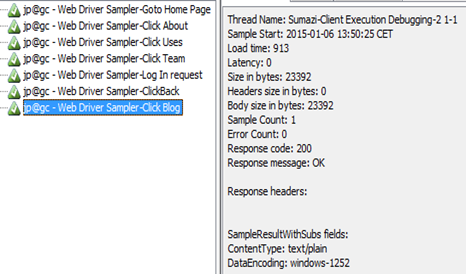
Now, lets see those individual test results from view result tree.
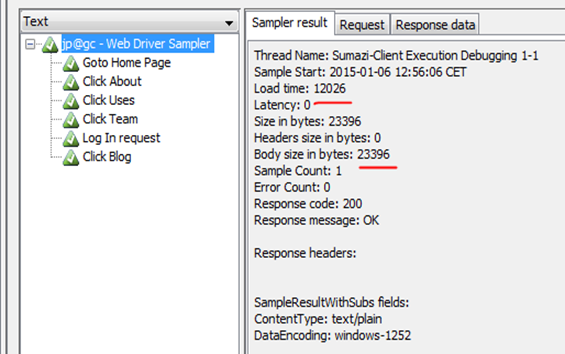
And, Finally the main sampler :
You might have noticed that those sub samplers do not have size value as it is part of main sampler.
Main, sampler is working like as Transaction which will be shown in table and results.
Benefits :
->You can get time for specific step without doing massive change in code. Just adding those boundary.
->It will not show in any listener table or graph, so your report format will be same. No effect.
Not Useful for :
-> If you want to measure size of the particular request. As it is part of a bigger request, it dont show specific size of the request. For this, you can follow like other method..
2. Keeping all steps in separate webdriver sampler :
Now, lets divide those steps among multiple webdriver sampler. Like this.
Let see Go to Home Page: webdriver sampler which contains only request to visit home page.
1: var selenium = JavaImporter(org.openqa.selenium)
2: var time = JavaImporter(java.util.concurrent.TimeUnit)
3: WDS.browser.manage().timeouts().implicitlyWait(30, time.TimeUnit.SECONDS)
4: WDS.sampleResult.sampleStart()
5: WDS.browser.get('https://www.sumazi.com/')
6: WDS.sampleResult.sampleEnd()
or Log in request.
you might have followed, this is the time start and end. No sub sampling. BTW, you can apply sub sampling here also.
The full JMX file is here from Google Drive Share. Please see details scripts in there.
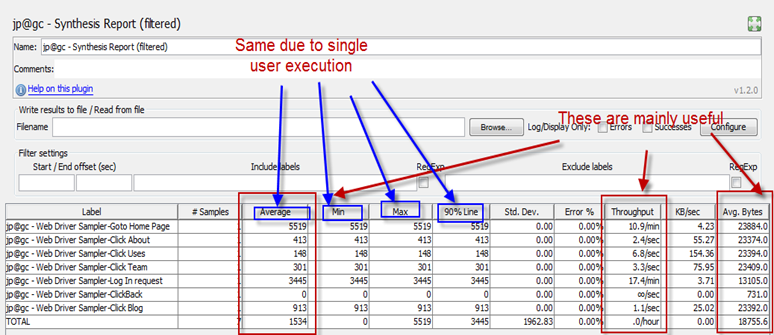
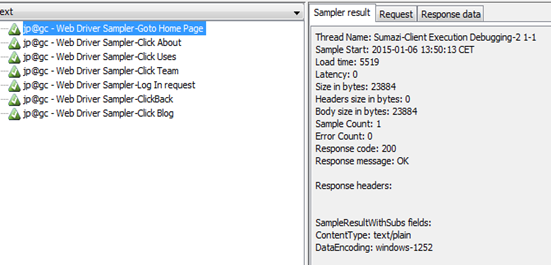
Now, lets run the script and see the view result tree. I am adding Synthesis Report to have more clear view. Form there..
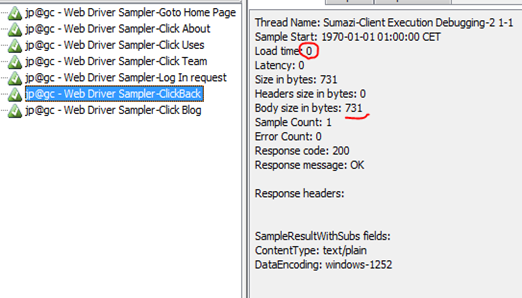
Let see view result tree :
You need to look at this. This step is only for click Back from Browser, so time became Zero as it is not request from application , browser just gets preloaded page.
I use this method to write my script from beginning so that others can understand clearly and we can apply particular step specific formulas(like JS run or any function call that applies on that step only).
Benefits :
->We can see individual request size with time
->You can represent multiple request to gather using Transaction Controller like we do for server scripts. In this way, it is easy to measure transaction time.
Should be careful when
->Large Script to maintain
->Have per-defined report format.
Note : For difference in business, you might need to make this more specific on using. I am showing some ways to have more clear on code. These are easy to start. I will post on code style separately.
Thanks…:)
2015-01-05
JMeter Client side performance testing : How to write web driver sampler code?
In this article we are going to see how to write code in JMeter webdriver sampler(from jmeter plugins). It is part of Jmeter Client side performance testing.
So, please follow that and have a run.
Let see firefox config , select default unless you have any specific settings.
In firefox tab, you can see changing user agent . This is for simulation of different version of firefox.
First one is, it will create new browser. It is necessary when you need to initiate session /cookie/browser data for each iteration. Useful when you are running multiple firefox in a single test execution.
Second one is for only debugging. Spatially when selenium don’t get the element, it is difficult for us to find the exact spot. It will stop execution and you can see where firefox holed.
BTW, as I told in my previous post , this start and stop part will calculate time. for the requests in between them.
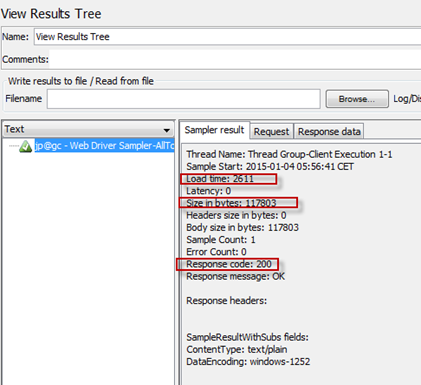
Now, lets see view result tree, from jmeter plug in site, they use view result table. But , we are going to see view result tree to have more detail idea on what just happened.
From sample result, we see load time, this is in millisecond. Which is exactly the time for going to Google from browser.
The size shows page size. And, see the response code. Though this is client side performance, but it is validating the page based on http 200 response not based on full page rendering. This is because, webdriver sampler is extension of http sampler which validates with response http 200 message.
Step 1 : Create a thread group (Test Plan –>Threads) and name that as Sumazi-Client Execution
Step 2 : Add, jp@gc - Firefox Driver Config under your thread. (right click thread –>add->config element ->jp@gc - Firefox Driver Config)
Step 3: Add jp@gc - Web Driver Sampler under your thread. (right click thread –>add->sampler ->jp@gc - Web Driver Sampler)
Step 4 : Add view result tree.
Step 5. Select use system proxy in Firefox driver config.
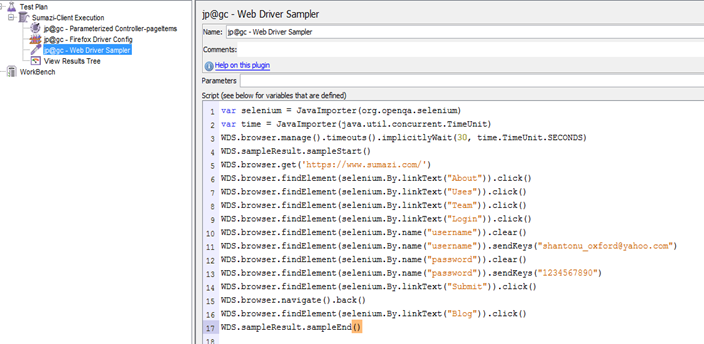
Step 6. Now, past the following code in webdriver sampler.
It will be like this
JMX file from Drive Share
As we know from previous post that webdriver plugins use selenium. So, make sure that you have selenium server(selenium-server-standalone-2.44.0) and firefox 26 in environment.
Now, Typically I would say, lets follow 2 min tutorial before start. You can get that from jmeter plugins sites.
So, please follow that and have a run.
I am using view result tree to have detail explanation. And, after following the link, It will be looking like this.
Let see firefox config , select default unless you have any specific settings.
In firefox tab, you can see changing user agent . This is for simulation of different version of firefox.
And, the experimental feature
First one is, it will create new browser. It is necessary when you need to initiate session /cookie/browser data for each iteration. Useful when you are running multiple firefox in a single test execution.
Second one is for only debugging. Spatially when selenium don’t get the element, it is difficult for us to find the exact spot. It will stop execution and you can see where firefox holed.
Now, let's see webdriver sampler. Its pretty basic
BTW, as I told in my previous post , this start and stop part will calculate time. for the requests in between them.
Now, lets see view result tree, from jmeter plug in site, they use view result table. But , we are going to see view result tree to have more detail idea on what just happened.
From sample result, we see load time, this is in millisecond. Which is exactly the time for going to Google from browser.
The size shows page size. And, see the response code. Though this is client side performance, but it is validating the page based on http 200 response not based on full page rendering. This is because, webdriver sampler is extension of http sampler which validates with response http 200 message.
So, your site UI elements loading time will be calculated but, it will not show any error in case of more time taken or no resource found. That means, for validation , you have to work manually. What I follow is, i used to check any text value after page loading which gives me exact time measured in my steps. And If I cant see the text(jmeter could not see), jmeter shows error and i get to know the previous request all data are not available yet in browser. This helps me in finding the exact delays and steps to follow.
So, now lets test a famous social media site https://www.sumazi.com/
Step 1 : Create a thread group (Test Plan –>Threads) and name that as Sumazi-Client Execution
Step 2 : Add, jp@gc - Firefox Driver Config under your thread. (right click thread –>add->config element ->jp@gc - Firefox Driver Config)
Step 3: Add jp@gc - Web Driver Sampler under your thread. (right click thread –>add->sampler ->jp@gc - Web Driver Sampler)
Step 4 : Add view result tree.
Note : I prefer to add a jp@gc - Parameterized Controller to keep my variables separate from test steps. You will see that from image in this post.
Step 5. Select use system proxy in Firefox driver config.
Step 6. Now, past the following code in webdriver sampler.
1: var selenium = JavaImporter(org.openqa.selenium)
2: var time = JavaImporter(java.util.concurrent.TimeUnit)
3: WDS.browser.manage().timeouts().implicitlyWait(30, time.TimeUnit.SECONDS)
4: WDS.sampleResult.sampleStart()
5: WDS.browser.get('https://www.sumazi.com/')
6: WDS.browser.findElement(selenium.By.linkText("About")).click()
7: WDS.browser.findElement(selenium.By.linkText("Uses")).click()
8: WDS.browser.findElement(selenium.By.linkText("Team")).click()
9: WDS.browser.findElement(selenium.By.linkText("Login")).click()
10: WDS.browser.findElement(selenium.By.name("username")).clear()
11: WDS.browser.findElement(selenium.By.name("username")).sendKeys("shantonu_oxford@yahoo.com")
12: WDS.browser.findElement(selenium.By.name("password")).clear()
13: WDS.browser.findElement(selenium.By.name("password")).sendKeys("1234567890")
14: WDS.browser.findElement(selenium.By.linkText("Submit")).click()
15: WDS.browser.navigate().back()
16: WDS.browser.findElement(selenium.By.linkText("Blog")).click()
17: WDS.sampleResult.sampleEnd()
It will be like this

Now , Run the script. You should see browser opens and you can get the the all methods are working.
Now, lets open view result tree listener and see what is in there.
So, the time is 10.851 second for all steps and size 23905 byte for full requests.
JMX file from Drive Share
This script only made for going to all URL and measures the full browsing time. This is combined of steps, like specific transaction. In next blog, we will see how to debug and break steps to get actual user time for particular request.
Thanks…:)
2015-01-04
How to run multiple version of firefox in windows for automation?
In this article we are going to see the tricks to run multiple version of firefox in windows 7. You can have multiple version but only one version should be in path variable.
This is spatially needed for running Jmeter with firefox 26 and selenium with latest supported firefox.
Before starting, we have to be sure that there is no firefox install in PC for all users. This is important as by default all firefox driver path are pointed to Program Files (or x86 for 32 bit). If firefox found in this folder, this method will not work. So,
Step 1. Un install firefox from the system if it is available for all users. Delete program data and temp files (for firefox) also.
Step 2. Install Latest firefox in particular user directory or any other drive. I have installed in my user directory.In My PC , updated firefox location is "C:\Users\Shantonu\Mozilla Firefox"

Step 3. As , firefox maintain all settings globally, so run firefox and disable all update from option

You might disable all health reports also form option ->advance->data choice
Step 4. Close firefox an open again to check update disabling works.
Step 5. Close firefox and install firefox 26 in either user directory or other folder. (in image my firefox 26 is installed in user directory). Open firefox and make sure that you see update settings are disabled (from option). In my PC, firefox 26 location is "C:\Users\Shantonu\Mozilla Firefox 26"
Now, technically you are ready to go. But, there might be some issues with firefox profile due to no firefox is installed in default location (mentioned in driver).

For this, you need to create a firefox profile. So,
Step 1 : Close all firefox and open latest firefox profile manager. For that , from start menu -> run this "<path to latest firfox>" -profilemanager
For my PC, it was "C:\Users\Shantonu\Mozilla Firefox\firefox.exe" -profilemanager

Step 2 : Create a profile , following the UI instructions. (Create Profile ->

->Next

Give name (I gave name JmeterSelenium) and choose a path (my path is "D:\Env\JmeterPlugins\firefoxProfile"). And click Finish.
So, you have created a firefox profile.
Now, if you close all and run , you can run firefox 26 (which should be in path variable) with jmeter and latest firefox with eclipse.
As well as working with latest firefox, you can run jmeter test with firefox 26.
And, for those people who run selenium , use this code (if u r using java)
System.setProperty("webdriver.firefox.bin", path);
before creating firefox driver.
Thanks...:)
This is spatially needed for running Jmeter with firefox 26 and selenium with latest supported firefox.
Before starting, we have to be sure that there is no firefox install in PC for all users. This is important as by default all firefox driver path are pointed to Program Files (or x86 for 32 bit). If firefox found in this folder, this method will not work. So,
Step 1. Un install firefox from the system if it is available for all users. Delete program data and temp files (for firefox) also.
Step 2. Install Latest firefox in particular user directory or any other drive. I have installed in my user directory.In My PC , updated firefox location is "C:\Users\Shantonu\Mozilla Firefox"
Step 3. As , firefox maintain all settings globally, so run firefox and disable all update from option
You might disable all health reports also form option ->advance->data choice
Step 4. Close firefox an open again to check update disabling works.
Step 5. Close firefox and install firefox 26 in either user directory or other folder. (in image my firefox 26 is installed in user directory). Open firefox and make sure that you see update settings are disabled (from option). In my PC, firefox 26 location is "C:\Users\Shantonu\Mozilla Firefox 26"
Now, technically you are ready to go. But, there might be some issues with firefox profile due to no firefox is installed in default location (mentioned in driver).
For this, you need to create a firefox profile. So,
Step 1 : Close all firefox and open latest firefox profile manager. For that , from start menu -> run this "<path to latest firfox>" -profilemanager
For my PC, it was "C:\Users\Shantonu\Mozilla Firefox\firefox.exe" -profilemanager
Step 2 : Create a profile , following the UI instructions. (Create Profile ->
->Next
Give name (I gave name JmeterSelenium) and choose a path (my path is "D:\Env\JmeterPlugins\firefoxProfile"). And click Finish.
So, you have created a firefox profile.
Now, if you close all and run , you can run firefox 26 (which should be in path variable) with jmeter and latest firefox with eclipse.
As well as working with latest firefox, you can run jmeter test with firefox 26.
And, for those people who run selenium , use this code (if u r using java)
System.setProperty("webdriver.firefox.bin", path);
before creating firefox driver.
Thanks...:)
Subscribe to:
Comments (Atom)


