In this following article we are going to see how to perform stress testing on a sample website(www.kaz.com.bd).
Before going inside of it, we should have basic idea on what is stress testing ? Stress testing is a form of testing that is used to determine the stability of a given system or entity[wiki]. Stress testing determines the data handle capability of a site
Before starting, we should know the basic working process with JMeter. If we go through the article step by step, it would be very easy for us to understand the basic work process of JMeter.
Step 1. : Start JMeter by clicking “jmeter.bat” from “apache-jmeter-2.8\bin” and you will see this

Step 2 : From here, you will see Test Plan. Our full test procedure will be under Test plan(as sub section).
JMeter allows for many different types of requests like as HTTP Requests, FTP Requests, WebService Requests, SOAP Requests and many others. In here we will see an example of HTTP Testing. When we have the basic idea we will try others in a same fashion.
Step 3 : Adding Thread Group :
A Thread Group will define is the number of users you want to use for stress testing. Or we can say, if you open www.kaz.com.bd as one user in pc browser, this Thread Group will do the same , the only difference is, you can define how many users you want to hit the target URL within a time span .
Now, right click on test plan and keep mouse on Threads(Users) and we will get Thread group, setUp thread group, tearDown thread group.

Select Thread Group and you will see the UI

Provide name as “KazTest”, comments as “Demo Stress Testing”. Please look at the options carefully, I have used 50 threads(means 50 users) in Ramp-up period 5 seconds(after each 5 second , 50 user will hit the URL). I use Loop Count as forever, meaning, I want to continue the test all times. If you provide any value in the in the Loop Count text box, this test will be continued up to that time.(i.e. 5 times). I will use Loop Count as 5. If you select the scheduler then the 4 text box will come to take the inputs. though I have selected to show, but I will not use that. So, my settings screenshot will be

Now, save the thread group in the PC to a suitable location.
Step 4 : HTTP Request Defaults : What is HTTP Request Defaults ? This is nothing but a configuration set of default http request settings which will be perform under our thread group.
For this, Add HTTP Request Defaults (under Config Element)to our KazTest.

After adding, provide this URL(www.kaz.com.bd) as Server Name or IP(out test site) .
We have left other options blank, but when we need we can configure Port, Protocol, Content encoding, Implementations , Timeout etc.There is also options to send any URL parameters with request(key-value pairs).
Step 5: Loop Controller : We will add a Loop Controller under Logic Controller. What is a Loop Controller? A Loop Controller simply runs all its child elements one by one in order up to the number that we configure. There is also Random Controller which does pretty much the same thing but does not do them in the specified order.

 Now that We have the Loop Controller in.
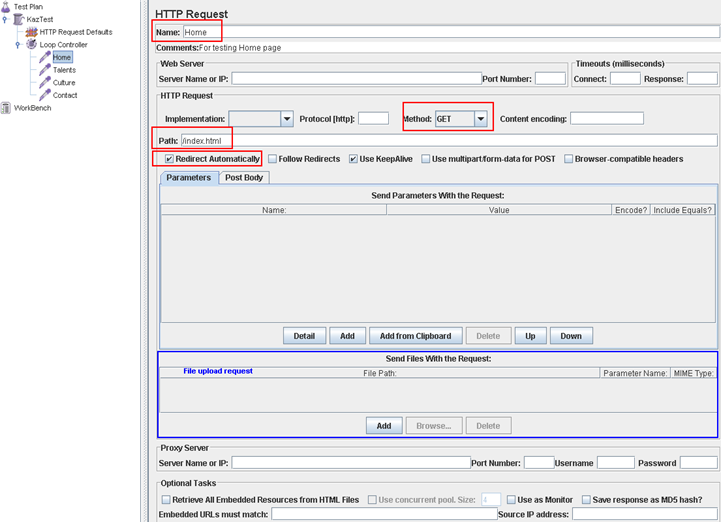
Step 6: Http Requests : We will add Http Requests for each of my page inside of that loop controller. This is because, the loop controller will hit the pages of my site.(In here, JMeter will execute as per the settings of the Loop Controller and the Thread Group) .In our URL(www.kaz.com.bd), we have 4 pages, Home, Talents, Culture, Contact. Lets add a Http Requests for Home page.

Right click on Loop controller->Add->Sampler->HTTP Request. When we add one , we will get similar page as “HTTP Request Defaults” with some extra Http request option. We will name every request as out page, select Redirect Automatically instead of follow redirects and put comments(optional). We will use Get method. Please look at the path section where you see that we have inserted only sub URL part of the full path this is because the base URL will be taken from initial setting at HTTP Request Defaults.

So my Http Request pages are Home,

Talents,

Culture,

and Contact.

So, Up to this we have completed the stress test arrangements using Http Request. Now, we need way of looking at the test results.
Viewing results :
For viewing data , we need to add some ‘Listeners’ to our Thread group. There are a few Listeners JMeter and all of them capture exactly the same data. The only difference is how they work with the data. Each Listener has its own purpose and analyses the data differently. To add a ‘Listeners’ right click on thread name(KazTest) –> Listener –> ‘Summary Report’. This will add ‘Summary Report” listener in the thread group. Like the same we will add total 4 Listeners to KazTest [‘View Results in Table’, ‘View Results Tree’, ‘Summary Report’ and ‘Graph Results’]. The process of adding these to our Test Plan are the same. We can add more listeners based on our needs. To read more about listeners see this.

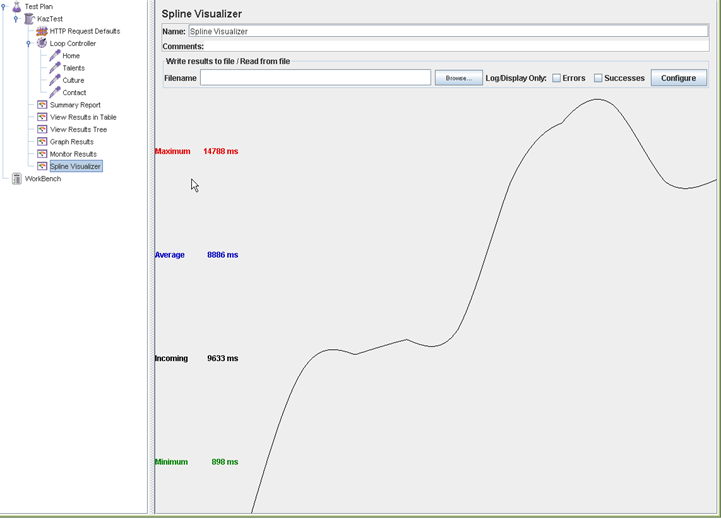
Now, We are ready for testing. To run your test, click on the Run Menu and then Start. Once we run the Test, we can see the data in the Listeners [I am providing some sample screenshots]


Some Extra Listeners …


So, that’s it. It is a very simple example using 4 requests. I have added only few listeners, you can add according to your need. We will learn details on those customization later on. I wrote this from the inspiration of this site.
Thanks…:)
Before going inside of it, we should have basic idea on what is stress testing ? Stress testing is a form of testing that is used to determine the stability of a given system or entity[wiki]. Stress testing determines the data handle capability of a site
Before starting, we should know the basic working process with JMeter. If we go through the article step by step, it would be very easy for us to understand the basic work process of JMeter.
Step 1. : Start JMeter by clicking “jmeter.bat” from “apache-jmeter-2.8\bin” and you will see this

Step 2 : From here, you will see Test Plan. Our full test procedure will be under Test plan(as sub section).
JMeter allows for many different types of requests like as HTTP Requests, FTP Requests, WebService Requests, SOAP Requests and many others. In here we will see an example of HTTP Testing. When we have the basic idea we will try others in a same fashion.
Step 3 : Adding Thread Group :
A Thread Group will define is the number of users you want to use for stress testing. Or we can say, if you open www.kaz.com.bd as one user in pc browser, this Thread Group will do the same , the only difference is, you can define how many users you want to hit the target URL within a time span .
Now, right click on test plan and keep mouse on Threads(Users) and we will get Thread group, setUp thread group, tearDown thread group.

Select Thread Group and you will see the UI

Provide name as “KazTest”, comments as “Demo Stress Testing”. Please look at the options carefully, I have used 50 threads(means 50 users) in Ramp-up period 5 seconds(after each 5 second , 50 user will hit the URL). I use Loop Count as forever, meaning, I want to continue the test all times. If you provide any value in the in the Loop Count text box, this test will be continued up to that time.(i.e. 5 times). I will use Loop Count as 5. If you select the scheduler then the 4 text box will come to take the inputs. though I have selected to show, but I will not use that. So, my settings screenshot will be

Now, save the thread group in the PC to a suitable location.
Step 4 : HTTP Request Defaults : What is HTTP Request Defaults ? This is nothing but a configuration set of default http request settings which will be perform under our thread group.
For this, Add HTTP Request Defaults (under Config Element)to our KazTest.

After adding, provide this URL(www.kaz.com.bd) as Server Name or IP(out test site) .
We have left other options blank, but when we need we can configure Port, Protocol, Content encoding, Implementations
 , Timeout etc.There is also options to send any URL parameters with request(key-value pairs).
Step 5: Loop Controller : We will add a Loop Controller under Logic Controller. What is a Loop Controller? A Loop Controller simply runs all its child elements one by one in order up to the number that we configure. There is also Random Controller which does pretty much the same thing but does not do them in the specified order.

 Now that We have the Loop Controller in.
 Step 6: Http Requests : We will add Http Requests for each of my page inside of that loop controller. This is because, the loop controller will hit the pages of my site.(In here, JMeter will execute as per the settings of the Loop Controller and the Thread Group) .In our URL(www.kaz.com.bd), we have 4 pages, Home, Talents, Culture, Contact. Lets add a Http Requests for Home page.

Right click on Loop controller->Add->Sampler->HTTP Request. When we add one , we will get similar page as “HTTP Request Defaults” with some extra Http request option. We will name every request as out page, select Redirect Automatically instead of follow redirects and put comments(optional). We will use Get method. Please look at the path section where you see that we have inserted only sub URL part of the full path this is because the base URL will be taken from initial setting at HTTP Request Defaults.

So my Http Request pages are Home,

Talents,

Culture,

and Contact.

So, Up to this we have completed the stress test arrangements using Http Request. Now, we need way of looking at the test results.
Viewing results :
For viewing data , we need to add some ‘Listeners’ to our Thread group. There are a few Listeners JMeter and all of them capture exactly the same data. The only difference is how they work with the data. Each Listener has its own purpose and analyses the data differently. To add a ‘Listeners’ right click on thread name(KazTest) –> Listener –> ‘Summary Report’. This will add ‘Summary Report” listener in the thread group. Like the same we will add total 4 Listeners to KazTest [‘View Results in Table’, ‘View Results Tree’, ‘Summary Report’ and ‘Graph Results’]. The process of adding these to our Test Plan are the same. We can add more listeners based on our needs. To read more about listeners see this.

Now, We are ready for testing. To run your test, click on the Run Menu and then Start. Once we run the Test, we can see the data in the Listeners [I am providing some sample screenshots]


Some Extra Listeners …


So, that’s it. It is a very simple example using 4 requests. I have added only few listeners, you can add according to your need. We will learn details on those customization later on. I wrote this from the inspiration of this site.
Thanks…:)
